
I wanted to know how Colibri, an open-source C engine, can run a 744B model on an ordinary machine. So I read the source at commit 0a5504a.
I did not run it. Every speed below is the project’s own figure, unless I say it is my estimate.
What is the core idea?
A mixture-of-experts (MoE) model is huge on disk, but each token uses only a small part of it. So Colibri doesn’t need the whole model in fast memory.
Attention, embeddings, routers and the other dense parts stay in RAM. The routed experts stay on disk. They are read when the router picks them, and then cached.
How big is GLM-5.2, really?
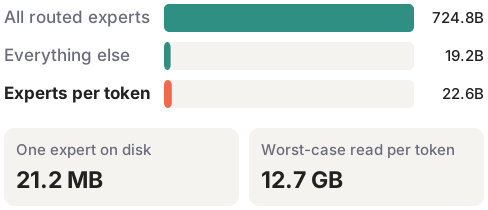
These numbers come from the model’s config: 78 layers with the first 3 dense, 256 experts per layer, top-8 routing, hidden size 6144 and expert width 2048.
| Quantity | Calculation | Result |
|---|---|---|
| One expert | 3 × 6144 × 2048 | 37.7M parameters |
| All routed experts | 75 × 256 = 19,200 experts | 725B of the 744B parameters |
| Experts used per token | 75 × 8 = 600 experts | 22.6B parameters |
| One expert on disk (int4 + scales) | 18 + 2.25 MiB | 21.2 MB |
| Worst-case read per token | 600 × 21.2 MB | about 12.7 GB |
The 21.2 MB matches a comment in the code. The README says about 11 GB per token. That number fits the per-row format, which I work out at about 11.35 GB, not the current one.
What happens at each layer?
All of this is in moe().
- Route. A float32 router scores all 256 experts with a sigmoid and ranks them by score plus bias. The chosen experts are then weighted by the unbiased score, normalised and multiplied by 2.5.
- Union. When several positions run together, each expert loads only once, even if many positions chose it.
- Place. Each expert is looked up in the pinned set, then the per-layer LRU cache, then disk.
- Compute. Each expert computes
down(SiLU(gate(x)) * up(x)). The results are added back with their weights, and the shared expert is added separately. - Learn. The engine updates its usage, heat and recency counters. This is only bookkeeping about which experts get used. No weights are trained.

What sets the speed?
My rough estimate is this:
I assumed a disk at 7 GB/s and left compute out, so this curve is only a ceiling.
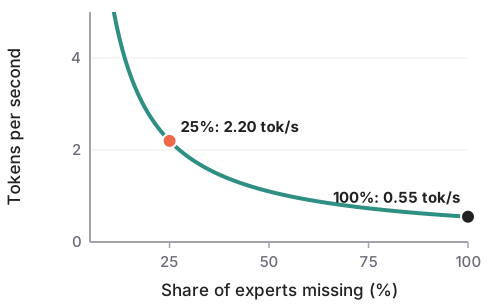
The project’s numbers fit that picture. A cold laptop with 25 GB of RAM gets 0.05 to 0.1 tok/s. A 32-core EPYC with a 97% hit rate gets 2.34 tok/s, and its logs show the CPU as the limit, not the disk.
This is also why a GPU helps differently from model to model. It is mainly a faster place to hold experts and dense layers. Experts it doesn’t hold still run on the CPU.
How does it “learn”?
The README says Colibri gets faster the more you use it. Here is what that means in the code.
.coli_usage stores how often each layer and expert pair was selected, and it’s saved every turn. At startup, experts are ranked across all layers by count and pinned until the budget runs out. Auto-pinning starts at 5,000 selections and grows to half the expert budget by 200,000.
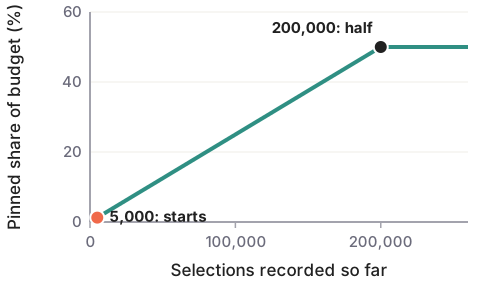
So the gain mostly shows up across restarts. Within a session, only the LRU cache adapts, unless you turn on --repin.
What other techniques does it use?
Int4 weights. Weights are stored as 4-bit values, with a float32 scale for every 64 inputs. The router and norms stay float32.
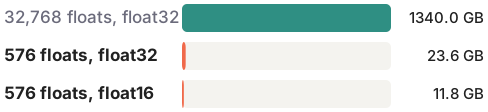
Compressed KV cache. GLM-5.2’s attention stores 576 values per token per layer instead of 32,768. I computed the sizes at 131,072 tokens. They are close to the README’s 23.9 and 11.9 GB for GLM-5.3.
Saved conversations. The KV cache is saved to disk by default, so a conversation can reopen without rereading the prompt.
Speculative drafts. A small extra head (MTP) drafts tokens, and the main model checks them in one batch. Only accepted tokens advance the KV cache. The project reports 2.2 to 2.8 tokens per forward pass when it pays off.
Prefetch (PILOT). This runs the next layer’s router on the current state, to guess which experts to load. The project reports 71.6% recall. It only loads ahead, and it’s off by default.
Where do the claims need care?
“Placement only ever decides speed.” This holds on the default path, with some exceptions. CACHE_ROUTE swaps in experts already in memory, and EXPERT_BUDGET drops missing ones. DEGRADE_ZERO zeroes low-weight ones, which the project measured at +2.9% perplexity at one setting and +41% at another. TOPK and --topp change the selection too. All of these are opt-in. The README also says a long answer on the GPU can drift from the CPU’s by a word.
“A faithful model.” This means faithful to the int4 file, not to the original weights. On OLMoE, per-row int4 lost 8.2 points of accuracy, and grouped scales recover about 63% of that. By my arithmetic that leaves about 3 points. GLM-5.2 scored 62.5% with n = 40, and I found no full-precision baseline to compare it with. So I would treat its real quality cost as unmeasured.
The docs and the code disagree on PIPE. tuning.md says the async loader is on by default, but the engine enables it only on Windows. On Linux and macOS, disk loads block unless you set PIPE=1.
Overlap is partial. Even with PIPE on, the CPU computes experts in order and waits at each miss. So an early miss stalls the resident experts behind it.
What did I not check?
I read routing, the cache lookup, the expert computation, draft checking, pin ranking and the defaults above. I only skimmed the GPU tier and the prefetch code, so treat those parts as lighter.
Why do I care?
Colibri’s POST /v1/systemone copies TypeSafe’s Jev API and returns a probability for each allowed answer. I’m building nanoJev, a small Jev-style encoder, so this gives me a possible comparison point.
Support the writing
If this post helped, a coffee keeps the deep dives coming.
Buy me a coffee